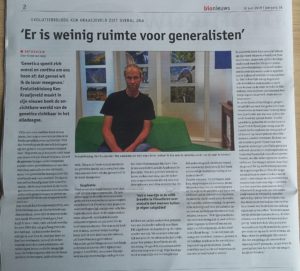
Like last year, I held a public lecture at Corpus. This time on DNA and evolution.
Alle berichten van ken
Public lecture in Corpus
World DNA day in Corpus
April 25th is world DNA day. The museum Corpus will host workshops and lectures by the LeveDNA! foundation. See here for the program.
EvoKE
Attended the recent EvoKE meeting in Porto, where an emerging new community gathered to discuss and develop projects aimed at increasing the understanding of evolution among the general public. See here for an impression.
Symposium sExtreme
Quote in National Geographic
A first look at NGS data
Let’s say you have run the DNA of your study species on a next generation sequencing machine, such as Illumina HiSeq. You now have a huge collection of short sequences to make sense of. The data is a text file that is too big to open in a regular text editor.
To have a look at the raw data, type:
less [name_of_data_file]
The format (fastq) tends to evolve, but lately it looks something like this:
@HWI-962:55:C0A4UACXX:4:1101:1375:2341 1:N:0:TCTCAG
GTCACTGATCGGGGAATTCGTACAGTCTCGTATATGTGAGTCAATGCGTCGTNGCTCCCCTTAACG
TACGTGCAATCTTGTCGGTTCGGCGGCACAAAA
+
B?BDFDDFHHHHHJJJDHHIEFGGGCGBFF6DFH@HBFHI9B@FDHIJBHH;#-5;CHFF;@@CED?BBD(5AACDACDDCCDD59@@BBBDB-9ABDB
The first bit includes the machine name and information of the run and position of the cluster on the flowcell. The first line ends with the barcode sequence. Then follow nucleotide sequence and a quality score. The quality scores can be in various formats.
You will want to have a closer look at the data quality before you proceed. The fastcq toolkit is very useful for this.
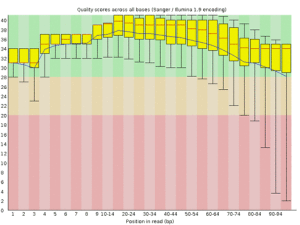
It generates quality plots like this:
The quality of the first few bases is slightly lower, because the machine starts sequencing at lower intensity, which allows it to locate the clusters more unambiguously. You’ll also notice that the quality drops off at the end of the read, which is due to reagents getting old. This is normal, and in this case it stays within an acceptable range. However, some trimming or clipping is often necessary. The fastx toolkit can be used for this. Alternatively, you can use a package that does all the trimming, clipping, adapter removal etc automatically. Many of these tend to be quite harsh. I tend to use Trimmomatic, which seems to do a good job. The command line looks a bit messy. Here is an example:
java -classpath /usr/local/Trimmomatic/Trimmomatic-0.17/trimmomatic-0.17.jar org.usadellab.trimmomatic.TrimmomaticPE -phred33 read1.fastq read2.fastq read1_forward_paired.fq read1_forward_unpaired.fq read2_reverse_paired.fq read2_reverse_unpaired.fq ILLUMINACLIP:illuminaClipping.fa:2:40:15 LEADING:3 TRAILING:3 SLIDINGWINDOW:4:15 MINLEN:36
Turkey 2012
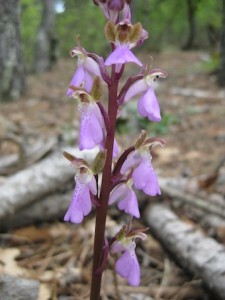
Better known for its holiday potential, the Antalya region of Turkey is an excellent place for orchids. Spending a few hours in a plane full of jobbo’s on their way to the compounds along the Turkish riviera was a bit of a culture shock. However, a short drive took us up into the hills where the people are friendly, the tea is sweet and the orchids are too.
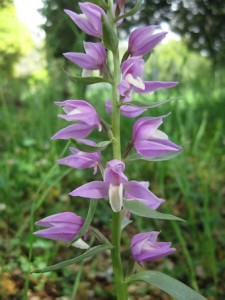
Finding orchids in Turkey requires a bit of effort. We visited lots of graveyards (where the people don’t collect orchid root bulbs for salep and the goats don’t eat orchids), few of which were actually any good. But then, some of them were very, very good.
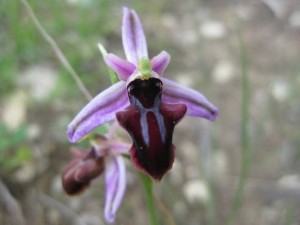
The other place to look for orchids is high up in the hills, far away from everybody else.
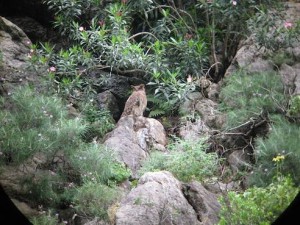
After a week of orchid hunting, we couldn’t resist checking out the brown fish owls at Oymapinar. For those who don’t know the story: a few years ago, a population of brown fish owls was discovered in Turkey, a species that was thought to be extinct west of India. The birds were found along streams in remote regions of Antalya province. Meanwhile over at Oymapinar, tourists were being shown large owls as part of a boat trip on a reservoir on a daily basis for years. In 2011, a birder happened to be on one of these boats together with his family. When he saw the owl, he thought “what the f***!!!” Since then the tourists are joined by birders from all over Europe. So, we joined some 30 Russian holiday makers and enjoyed the sight of three brown fish owls – accompanied by the sound of loud disco music. Surely one of the more surreal birding experiences: having one of the rarest birds of Europe stare at you with “I’m sexy and I know it” pounding your eardrums.
Effect of climate warming on population genetics in the Arctic
The effect of global warming on arctic animals and plants
In the wake of Al Gore s book An inconvenient truth, the polar bear is now popularly perceived as being at risk of extinction. Global warming is causing a reduction in the amount of sea ice in the Arctic, depriving the bears of their hunting grounds. Of course, now is not the first time that the earth experiences a rise in temperature. In fact, there have been several periods in the not-so-distant past where the global temperatures exceeded those of today. Pollen records, beetle remains and other evidence suggests that the amount of high Arctic tundra was smaller during those times than it is today. This is illustrated in the figure below (see Kraaijeveld & Nieboer 1998 for references). If the polar bear and other organisms living in the high Arctic are on the brink of extinction now, they must have only just survived these previous warm episodes. Several plants and animals of the high Arctic have been the subject of population genetic studies. If global warming causes population declines in these species, then we should see severely reduced genetic variation in high Arctic species compared to related species from more southerly regions. On this page, I assess whether this prediction holds.
Eemian interglacial (125,000 years ago)
Holocene climatic optimum (8,000 years ago)
Figure: Extent of tundra habitat in Eurasia during warm periods.
Polar bear – high genetic diversity
A number of studies have investigated genetic variation in polar bears, aided by the availability of microsatellite markers. Generally, the estimates for expected heterozygosity (a measure for genetic variability) were around 0.7 (Paetkau et al. 1999, Cronin et al. 2006, Crompton et al. 2008, Cronin et al. 2009). This is high and does not indicate population bottlenecks in the recent past. Variation was also found in mitochondrial DNA sequences (Cronin et al. 2006). Thus, there is no evidence that the warm episodes at the end of the Pleistocene and particularly that at the start of the Holocene caused collapse of the polar bear population.
Arctic foxes and wolves – high genetic diversity
Of the species discussed here, arctic foxes are probably the most similar to polar bears in terms of ecology. Carmichael et al. (2007) sampled 1700 arctic foxes from across Alaska, Canada and Svalbard and found high levels of genetic variation and no genetic structure. It is thus clear that arctic foxes have survived both cold and warm periods in recent history unscathed. Other studies have found that arctic foxes on Greenland and in Scandinavia are less diverse.
The same study found clear-cut genetic structure among more than 2000 wolves from northern North America. Wolves are divided into ecological races. Of these, the ones inhabiting the islands of the Canadian high arctic are less diverse than those from the boreal areas to the south.
Muskox – low genetic diversity
The muskox is one of the few survivors of the Arctic megafauna of the Pleistocene. It lives only in the far north of Greenland and Canada. As shown in the figure above, the amount of habitat suitable for muskox was severely reduced during warm periods. On the other hand, vast amounts of suitable habitats would have been available during the Ice Ages.
Holm et al. (1999) found very low diversity at 21 microsatellite loci in muskoxen from western Greenland. This included loci developed specifically for Muskoxen and loci developed for domestic cattle. The latter included a locus that has proven highly variable in species as distantly related as harbour porpoise, yet showed no variation in muskoxen. Similarly, low levels of diversity were reported for mitochondrial DNA, allozymes and MHC loci (see Holm et al. 1999 for references).
Thus, low genetic diversity appears to be a general feature of muskoxen populations. This has not always been the case. MacPhee et al. (2005) examined mitochondrial sequences in ancient DNA recovered from fossils dating back to the late Pleistocene. Among these sequences were several haplotypes that are not present in the current population of muskoxen. The youngest of the samples still containing these extinct haplotypes dated to after the late glacial maximum (the coldest period of the late Pleistocene). While there were too few samples to establish the exact timing of the loss of genetic variation in the muskox, the data is at least consistent with the idea that it was caused by the warming at the start of the Holocene.
A new large-scale ancient DNA study (Campos et al. 2010) provides more detail. MtDNA sequences recovered from 149 muskox samples spanning the last 60,000 years allow estimation of past population sizes. It turns out that muskox populations peaked during cold periods (MIS4 and the late glacial maximum) and dropped during warm phases (the MIS3 interstadial and the Holocene). These population contractions caused local extinctions: muskoxen disappeared from northeastern Siberia during the MIS3 interstadial and from Taymyr and the Urals during the Holocene. The recent colonisation of Greenland may have saved this species from complete extinction. Of course, this does not tell what it was about the warm periods that caused problems for muskoxen. The culprit may have been a combination of (i) reduction of available tundra habitat due to northward expansion of boreal forest, with (ii) increased precipitation causing increased snow cover in the remaining tundra.
Steppe bison – low genetic diversity
Large herds of steppe bison roamed the tundra steppes of Asia and Beringia during the Pleistocene. They became extinct at the end of the Pleistocene, together with most of the other megafauna such as mammoth and woolly-haired rhinoceros. Shapiro et al. (2004) sequenced a section of mitochondrial DNA from 442 bison fossils to assess the genetic variation over time. Radiocarbon dating of the same fossils allowed precise timing of the extinction event. The results indicated that steppe bison populations were large and increasing up to about 35000 years ago. After that the population size declined rapidly and eventually steppe bison went extinct. The decline coincided with a warm episode during the late Pleistocene, when boreal forests invaded large areas of former steppe-tundra.
The evidence for steppe bison thus suggests that it was a warm period that caused their populations to crash. It remains unclear how these and other megafauna of the steppe-tundra survived earlier warm episodes, like the Eemian interglacial.
Lemmings – low genetic diversity
In an interesting paper, Fedorov (1999) compared the mitochondrial DNA diversity of two genera of lemmings. One (Dicrostonyx) is a true tundra lemming, while the other (Lemmus) occurs further south in the boreal forest. Across Siberia and Alaska, the levels of genetic diversity in the tundra lemming were consistently lower levels than those of its southern counterpart.
This result indicates that the tundra lemmings, but not the boreal lemmings, went through a severe demographic bottleneck. Fedorov suggests that this bottleneck did not occur during the cold phases of the Pleistocene, as the patterns of genetic diversity were the same for areas that were glaciated during those times as in areas that remained unglaciated. Rather, the population contraction of the tundra lemmings is attributed to the spread of boreal forests during the early Holocene. Only on Wrangel island, which was neither glaciated nor invaded by boreal forest, did a genetically diverse population of tundra lemmings persist. It worth noting that Wrangel was also the home of the last population of woolly-haired mammoths, which only went extinct about 4000 years ago (Vartanyan et al. 1995).
Another rodent, the arctic ground squirrel, is widely distributed over the tundras of eastern Siberia, Alaska and Canada. The species shows considerable genetic variation and is subdivided into several distinct clades (Eddinsaas et al. 2004). It is noteworthy that the subspecies from the far north of Alaska is much less diverse than those from further south (Eddinsaas et al. 2004).
Shorebirds – low genetic diversity
The red knot is a shorebird that breeds on the high arctic tundras of Siberia, Alaska and Canada. Its mitochondrial DNA (control region) shows very little diversity. The species is thought to have gone through a bottleneck within the last 20,000 years, during which the entire population was reduced to a few thousand breeding females (Buehler & Baker 2005). Another shorebird with a similar breeding distribution, the ruddy turnstone, is similarly genetically depauperated (Wenink et al. 1994).
The population genetics of these two species that are largely restricted to the most northern tundras an polar deserts contrasts with that of a related species, the dunlin. Dunlins have a much broader distribution that extends much further south. This species has high levels of genetic diversity and its phylogeny shows deep bifurcations.
Plants – high genetic diversity
Several tundra plants have been subjected to population genetic studies. Most of these, including Saxifraga oppositifolia, Vaccinium uliginosum, Minuartia biflora, show considerable genetic variation and genetic structure. However, these species are not restricted to the high arctic and have populations in mountain ranges further south.
The only exception appears to be Ranunculus pygmaeus, which virtually lacks genetic variation across vast areas of the arctic (Schonswetter et al. 2006). However, this lack of genetic variation appears to be due to the invasion of these areas by a single selfing lineage following deglaciation.
Conclusions
It may be worth a proper meta analysis, but from the list above it seems clear that a low level of genetic diversity is a common feature of organisms living on the high Arctic tundra. The same is not seen in related species from the boreal zone further south. The population bottlenecks that reduced the genetic variation in high Arctic species all date back to the late Pleistocene or early Holocene. This was a period of great climatic turmoil and it will always be difficult to pinpoint whether the population decline was due to a warm period, the sudden cold period of the Younger Dryas or indeed, as some have it, due to overhunting by humans. Still, where more detailed information is available, such as in the steppe bison, it is the warm episodes that appear to be to blame. This makes intuitive sense. It is easy to see how the encroachment of boreal forests onto the tundra habitat could have reduced the feeding habitat for tundra species. Tundra habitat was very extensive during cold periods, including the Younger Dryas, so it is difficult to see how this could have caused problems for such species. It is even more difficult to imagine how small bands of humans could have exterminated huge herds of mammoth, bison and other large ungulates in the vastness of Siberia.
So, will the polar bear go extinct?
It is clear from the above that climatic warming and the associated reduction in the amount of tundra habitat can cause population declines and species extinctions. The signs for species such as musk ox and red knot are ominous. These species appear to have only just survived the warming at the end of the Pleistocene and the beginning of the Holocene. They may not be able to survive this time round.
The polar bear itself actually seems to be a different matter. The polar bear does not rely on tundra, but instead feeds mostly on the sea ice. Both the polar bear and its ecological relative, the arctic fox, have substantial amounts of genetic variation and thus seems to have survived the previous warm periods without much problem.
References
Buehler DM & Baker AJ 2005. Population divergence times and historical demography in red knots and dunlins. Condor 107: 497-513.
Campos PF, Willerslev E, Sher A, et al. 2010. Ancient DNA analyses exclude humans as the driving force behind late Pleistocene musk ox (Ovibos moschatus) population dynamics. PNAS early edition.
Carmichael LE, Krizan J, Nagy JA, Fuglei E, Dumond M, Johnson D, Veitch A, Berteaux D & Strobeck C 2007. Historical and ecological determinants of genetic structure in arctic canids. Molec Ecol 16: 3466-3483.
Crompton AE, Obbard ME, Petersen SD & Wilson PJ 2008. Population genetic structure in polar bears (Ursus maitimus) from Hudson Bay, Canada: implications of future climate change. Biological Conservation 141: 2528-2539.
Cronin MA, Amstrup SC & Scribner KT 2006. Microsatellite DNA and mitochondrial DNA variation in polar bears (Ursus maritimus) from the Beaufort and Chukchi seas, Alaska. Can J Zool 84: 655-660.
Cronin MA, Amstrup SC, Talbot Sl, Sage GK & Amstrup KS 2009. Genetic variation, relatedness, and effective population size of polar bears (Ursus maritimus) in the southern Beaufort Sea, Alaska. J Hered 100: 665-674.
Eddinsaas AA, Jacobsen BK, Lessa EP & Cook JA 2004. Evolutionary history of the arctic ground squirrel (Spermophilus parryii) in Nearctic Beringia. Journal of Mammology 85: 601-610.
Fedorov VB 1999. Contrasting mitochondrial DNA diversity estimates in two sympatric genera of Arctic lemmings (Dicrostonyx: Lemmus) indicate different responses to Quaternary environmental fluctuations. Proc R Soc Lond B 266: 621-626.
Holm LE, Forchhammer MC & Boomsma JJ 1999. Low genetic variation in muskoxen (Ovibos moschatus) from western Greenland using microsatellites. Molec Ecol 8: 675-679.
MacPhee RDE, Tikhonov AN, Mol D & Greenwood AD 2005. Late Quaternary loss of genetic diversity in muskox (Ovibos). BMC Evolutionary Biology 5: 49.
Paetkau D, Amstrup SC, Born EW, Calvert W, Derocher AE, Garner GW, Messier F, Stirling I, Taylor MK, Wiig O & Strobeck C 1999. Genetic structure of the worlds polar bear populations. Molec Ecol 8: 1571-1584.
Schonswetter P, Popp M & Brochmann C 2006 Rare arctic-alpine plants of the European Alps have different immigration histories: the snow bed species Minuartia biflora and Ranunculus pygmaeus. Molec Ecol 15: 709-720.
Vartanyan SL, Arslanov KA, Tertychnaya TV & Chernov SB 1995. Radiocarbon dating evidence for mammoths on Wrangel Island, Arctic Ocean, until 2000 BC. Radiocarbon 37: 1-6.
Wenink PW, Baker AJ & Tilanus MGJ 1994. Mitochondrial control-region sequences in two shorebird species, the Turnstone and the Dunlin, and their utility in population genetic studies. Molec Biol Evol 11: 22-31.
De novo assembly course Leiden
Lecturing in advanced course on de novo genome assembly at the Leiden University Medical Center